What did we learn about machine learning?
This is part 2 in a series about Estimating the LTV of new SaaS customers. To do this we're taking all the datapoints we have about a user after X days and seeing whether we can predict how much revenue they'll spend in their first year.
In Early Prediction of Lifetime Value (LTV) we left off when we had a CSV full of features and the Year1Revenue(Y1R) that we were trying to predict. It was time to put the pedal down and see whether machine learning is all it's cracked up to be.
Regression Models with Vowpal Wabbit
So, Part 1 we ended up with a CSV that looked like:
user_id, utm_medium, utm_source, food_type, n_orders, …, actual_y1r
Our first pass was to do some basic linear regression. This is a good first step so you can see what the relationship is between your features. Vowpal wabbit is the perennial favorite of the Kaggle crowd, so we started there. No, that name is not a joke. The input format is pretty easy to understand. It’s lightning fast. And it has some nice built in protection against overfitting.
To get started we first need to turn your CSV into Vowpal's input format. Happily, that's pretty easy and quite readable (as these things go). Rows look like this:
40 |b event_day_of_week=Mon |c event_local_time:1200 ...
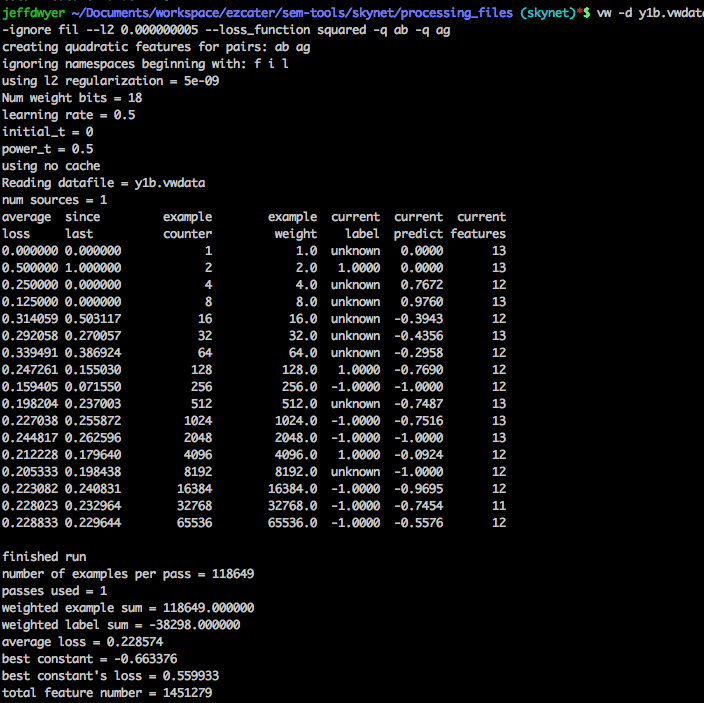
You run this through the wabbit and you get something like:
Then you can do a special “inversion” to actually see the weights it’s assigning:

Our results were... ok. But this brings up a major pain point of vowpal wabbit. Figuring out how “good” our results were was not easy out of the box. Sure, you get an average loss. And you can compute R^2 without too much trouble. But, what does that really mean? Can we make business predictions off this?
To solve this meant bolting a lot of R on top of the results and wading through ROC packages and stats textbooks.
Limits of Regression
Looking at our results, it seemed like linear / logistic regression was forcing us to be very knowledgeable about our feature interactions (co-variance). For example, people that order food for a Saturday are not as good customers (they’re not business customers). Regression models all pounced on this and put massive negative weights on this as you would expect. The problem is that for the small group of users that WERE good with a first Saturday order, they were unable to escape the negative weight. There were users that were clearly good: ordering multiple times a week, but because their first order was Saturday they got a low prediction.
The “magic bullet”-ish solution here was to give Gradient Boosted Trees a try. They allow almost “if then” logic within your model because of the nature of how the trees work. With GBT we could see “if they aren’t big orderers AND their first order was on Saturday then they should really be low”.
The popular GBT library is XGBoost, but that was a bit more of a pain to install, requires a totally different input format then GBT and wasn’t particular easy to analyze either.
Enter RapidMiner
My ad-hoc ruby code was getting pretty messy at this point, I wasn't excited to learn another command line tool and I wondered whether there was a was to quickly try different models on the same dataset.
Using RapidMiner I had the same regressions running that I had in vowpal in about 2 hours (they have good documentation and a free trial). And converting to GBT was literally dragging and dropping a different model in. It felt a little bit too easy, but it was fun.
Here's what it looks like to use RapidMiner:
1. Run SQL against Redshift and save it to a local datastore

2. Pull data out of the datastore and shuffle it, generate additional attributes and tell it which column is the target you want to learn.

3. Split data into a training set, train a model and cross validate, take the model and apply that to the unlabelled data. Save the results to S3. Run various performance metrics.

4. Edit Details of our Gradient Boosted Tree

5. View Details of the GradientBoostedTree


Rapid Miner Wrap-Up
This is what RapidMiner looks like when you're actually using it. For us it hit the sweet spot between being easy to use and powerful. Bringing new data scientists into the fold is also really easy when you can point them at one of these diagrams to describe what's happening at a high level.
RapidMiner in Production
Our business runs off the data warehouse. All we needed to do to add our new EY1R numbers to all our dashboards was to do a nightly copy of the CSVs that RapidMiner put in S3 into the warehouse.
Schema for our predictive LTV
We build models and make predictions at many "time horizons". We train a model on 7 day data and a separate model for 14, 21, 30 and 90 day horizons.
Query to get the "most accurate" prediction for each user
With multiple algorithms/day-horizons for each user we then use the following query to pull the best data for each user.
So how well does it work?
Quite well. As a disclaimer, conveying "how well does it work" is a pretty darn involved process. It really depends what you're using it for. The details and subtleties matter and there's just too much for a single blog post. That said, I think a few visuals are pretty illuminating. Let's start with what the "real" EY1R looks like. Here is the average, weekly EY1R.
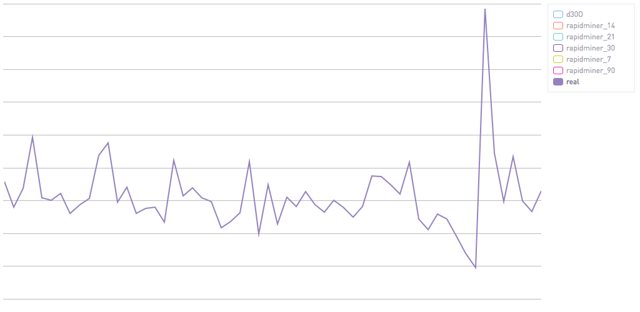 Using only the first seven days of a user's data we're able to predict a decent amount. This corresponds to an R^2 of .23.
  Using 30 days of data you can see that the algorithm starts to be far more confident. Both for the "bad" cases and the good ones. This corresponds to an R^2 of .51.
 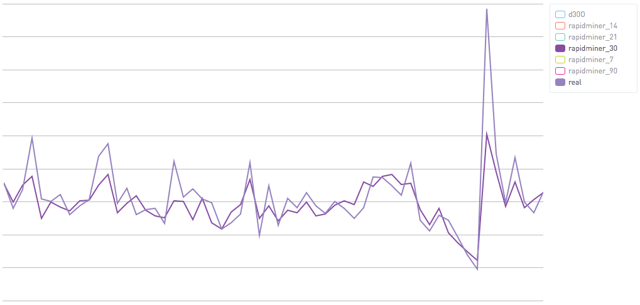 Finally, with 90 days of data you can see that we are really right on. This corresponds to an R^2 of .72.
 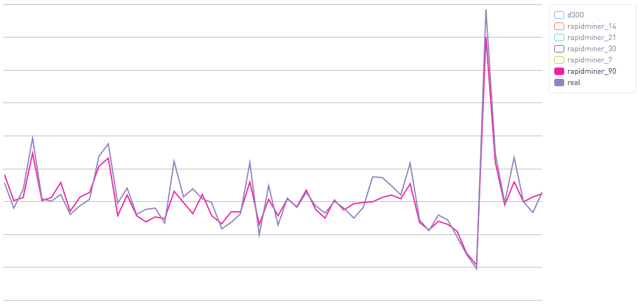 These are the averages, and I would emphasize that you really need to be careful looking at averages (vs percentiles). At a high level though this shows that this is an effective technique. Better yet, you will note that the earlier predictions are too conservative, both positive and negative. That's a great thing. Since our "baseline" is just assuming that everyone has the average Y1R of all customers, it's critical that our new methods not be worse than that. We want a cautious algorithm and that's just what we see here.
What's Next?
Next up is giving this a go on your data. EY1R has totally transformed the way we operate our business. We now evaluate most of our experiments based on whether or not they increase net EY1R, not just on conversion rate.
Beyond experiments, EY1R has proved enormously useful around the business from finance to sales. If you are a SaaS-like business where not all users are created equal it is really worth the effort to get a predictive model together if you want to evaluate changes to your new customer flow.
