So, you've read about how to get your event data in Redshift, you've read about the experiment exposure event, you've got your AB test ready to run, now... how do you decide if you've got a winner?
The trouble with numbers
I'm going to go out on a limb and say that statistics wasn't your favorite class. Perhaps you can nod along and smile when I say "distribution of test statistic in a one tailed test". Maybe you've read How not to run an AB Test and Most of Your A/B Test Results Are Illusory and That’s Okay, but I'm going to guess that all you really wanted was to know whether you can trust that your test was likely valid and whether you can make a decision.
Peeking
As somebody who has spent a lot of time trying to make up for an gap in my statistical knowledge and has had the fight about "you're not allowed to look at an AB test before it hatches" about 100 times. I will say I know one thing for sure: "everyone peeks." There's simply no way to reasonably expect web developers to change the website and not expect them to see whether it seems like it's doing something even before it reaches the "statistical power" necessary for a real decision.
But the math of why it's problematic to "peek" is real, so what do we do about that? Well we have two things we use at ezCater that I think really help us out: p-value graphs and high-thresholds for P.
P-Value graphs
This is a concept we found in a fabulous blog post by Airbnb and they look a little something like:

Our version has 3 lines on it. One for the number of conversions in the control. One for the number of conversions in the experiment. One for the "rolling cumulative p-value". What's that? Cookie Monster style tl;dr "Green line go to top mean experiment win a cookie. Green line in middle no cookie. Green line on bottom bad. You lose cookie".
I should be clear that it's no more valid to look at one of these graphs and cherry pick a p-value you like and call it significant. They key insight of these graphs is that they really reinforce when you're doing a "bad" thing. If the graph is flying around, high and low and just happens to come out significant one day, it's pretty obvious that you're looking at noise. On the other hand, if there's a steady march down to .02 then we feel pretty decent about calling it.
 This one is definitely significant.
Here's the SQL for how to make awesome p-value charts.
Tracking Experiments
So now that we've got all our experiment infrastructure in place, how do we actually keep tabs on what we're actually doing? Two pieces: the experiment sheet and the experiment docs. The sheet is straightforward. Keep track of the basics so you can see what is live & what has completed.

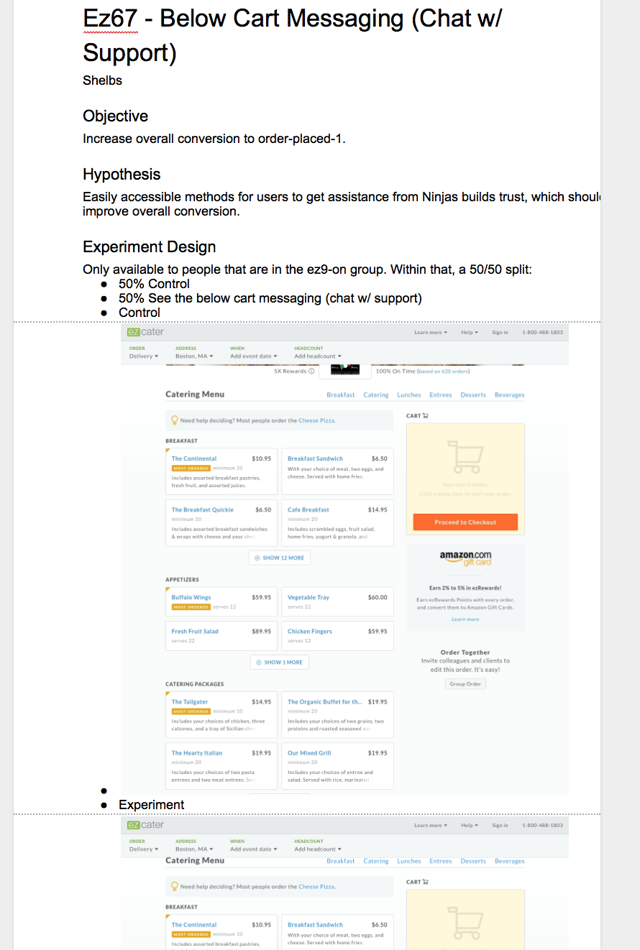
The Experiment Document
The core of the experiment process comes straight from Brian Balfour and Reforge. (Sadly Brian has not employed a referral strategy for building leads to Reforge yet, so this is an unpaid promotion for it, but you really must must must attend it. It's the best content around building growth you'll see)
Each experiment doc helps us focus on the "why" of the experiment and not the "how". Why are we doing this experiment? What are we trying to learn? We try to keep it at top of mind that learning is far more important than increases in conversion rate. If you have a solid learning you can replicate it again 10x. If you just accidentally increase conversion rate, you have no idea how to do it again.
Here's an example of one of our docs:
Experiment Completion
And when the experiment is finished, we screencap the p-value graph and record off our learnings in the experiment doc.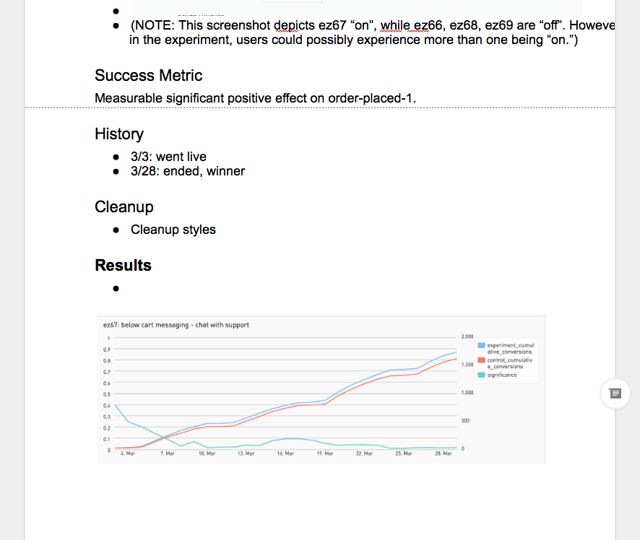 That's all we've got time for. If you're interested in the SQL or event schema for all of this be sure to check out the other posts in this series.
